The Complete Guide To Price Action Trading(all you need to know about price action trading 2019 in nigeria)

The Epic Guide to Price Action Trading
GUIDE INDEX
- What is Price Action Trading?
- The Psychology of the Candlesticks
- How to Benefit From Price Action
- Working With Different Market Conditions
- Trending Markets
- Ranging Markets
- Consolidation Structures
- Common Candlestick Patterns
- Reversal Patterns
- Pin Bar
- Rejection Candle
- Outside Candle
- Breakout Catalysts
- Inside Candles
- Doji Indecision
- Different Mediums of Price Action
- Traditional Candlesticks
A long time ago, technical analysis was

put in the same bucket as astrology, palm reading and fortune cookies – no one actually thought there was any merit to it.
Anyone who used it was considered foolish. Fast forward to today and you would be considered a fool not to be using it.
Technical analysis, like price action, now dominates the industry. Most traders consider the technical their ‘trading religion’ and rely heavily on it to make confident choices.
Due to its popularity, traders have made price action a self-fulfilling prophecy. So much so that even those who trade primarily off of fundamental or economic data, must still fall back on the charts and perform price action analysis if they’re going to make sound trading decisions.
If you’re a passionate, aspiring trader, and truly want to attune your skills to become a master of the charts – one way or another, you will find yourself studying price action. It is unavoidable.
If you don’t take the time to learn about price action trading now, your analysis is going to have as much conviction as a glass hammer. Don’t neglect this vital skill for technical analysis or you will be left behind in this cut throat industry.
As a retail ‘make money from home’ driven trader, some of the best strategies you can use to succeed with Forex trading are derived and mastered from a good understanding of price action.
In this comprehensive guide, I would like to present a detailed walk-through with a wide coverage of the whole price action methodology.
Enjoy…
WHAT IS PRICE ACTION TRADING?
Price action trading is a very hot topic of discussion in the Forex industry. Many seek out knowledge to learn this valuable insight into understanding the market – and for good reason, because it works!
To put it simply, the term ‘price action‘ is defined as the analytical study of price movement. It is widely considered a compulsory learning step for traders because it is the life blood, soul, and backbone of technical analysis.
Most charts used for trading are graphical representations of price movement vs time (price on the y axis, and time on the x axis).

Think of price action as the ‘language’ of the market. Once you learn to the read the charts and develop the crucial skill of translating the price action footprint on the chart, it will transform you into a very confident trader.
After a trader learns how to read the price action, they will often report that they look at the market from a whole new perspective and they don’t know how they were ever able to survive trading without it!
As a price action analyst, it’s your task to look at current price behavior and compare it with past behavior. The comparison of what’s happening now vs. the history of price behavior can arm you with the knowledge needed to accurately forecast future price movements – this is quantitative analysis 101.
This approach works because the same price action patterns occur repeatedly and tend to produce the same reaction over and over again. By learning these patterns we gain the statistical edge we need in this game, especially when combined with basic chart analysis.
Your edge as a price action trader boils down to how good you are at finding these reoccurring patterns, and recognizing the conditions they form under.

These patterns can provide a day-versus-night difference in helping you forecast future price movement with a high degree of accuracy – which gives you the opportunity to position yourself ahead of the moves. Think of price action like an ‘early bird warning’.
Price action traders can enjoy the skill of reading, understanding, and projecting future price movements without relying on black box-esque indicators (which draw the attention of so many new traders). If you go back to the basics and learn to read the charts – your success as a trader will grow.
SUMMARY
The study of price action is the study of historical price movements. The price action trader learns how to read a plain chart and exploit reoccurring price patterns for a profit. All technical strategies can benefit from a good understanding of the price action, and it works on all markets.
THE PSYCHOLOGY OF CANDLESTICKS
Did you ever consider becoming a psychologist one day?

Well, in this business you will need to use psychology effectively in order to succeed.
Firstly, you’ve got the constant task of psycho-analyzing yourself, to quarantine any self-destructive behaviors – but that is just the tip of the iceberg…
Not many traders realize this, but when you look at a price chart, you’re actually peering deep into the psychology of the market itself!
How you ask?
Well, a candlestick (or bar) is a visual representation of the collective thoughts of all market participants. A candlestick shows you the mood, emotions, and conflicts of everybody involved in the market during a given period.
This concept may elude a newbie trader who may view the market perhaps as a technical or mathematical puzzle – but with increased exposure, traders begin to realize that the financial markets are actually giant psychological battlefields.

The humble candlestick reflects everyone’s thoughts and expectations of future price movement.
Because the market follows a ‘herd mentality’, it allows for the same or similar situations to occur over and over again. The psychology of the crowd will generally drive price to repeat the same outcome as it has in the past under the repeated circumstances.
To illustrate this example, consider this scenario: price rallies into a known resistance level, the ‘herd’ knows this is a likely turning point on the chart and they begin to sell. Price action is self-fulfilling.
The more of the crowd that sells, the more intense the bearish price action becomes, which will attract more sellers… and so on. This kind of market behavior is likely to leave behind a bearish reversal candle, a pattern manifested from the psychology of the herd.
By becoming the savvy ‘chart psychologist’, you’ve learned to recognize this bearish reversal pattern repeating over and over, and know to expect future lower prices to develop as more of the crowd ‘follows the herd’, and continues to join in the selling.
Traders may say that the news, big banks, hedge funds or governments are responsible for moving the market – but if you think about it it’s really crowd psychology that is the core driver of price movement. You don’t want to swim against the tide or you will drown, so your job as a chart reader is to anticipate the crowd’s response and flow with it.
Understanding herd psychology can put you into the right mind-set needed to overcome the challenges and exploit the opportunities presented on the chart via price action.
SUMMARY
Psychology is the core driver behind price movement and the candlesticks are the visual reflection of everyone’s collective thoughts about future price movement. The natural ‘herd mentality’ of the market participants creates repeated scenarios, leaving behind compelling chart evidence in the price action which you can use to forecast where price is likely to move next with a high degree of accuracy.
WHY ALL TRADERS BENEFIT FROM THE MASTERY OF READING PRICE CHARTS
The common trader is prone to the

‘shiny new object’ syndrome. They flock to the latest and greatest indicator that promises to do all the thinking for them, or to exploit some ‘unknown secret’ to the markets.
Most newbies innocently get caught up in these indicator campaigns, which are designed mostly by internet marketers looking to get rich quick.
The indicators are usually very crude and don’t offer consistent results or insight into the markets so that you can make consistent long term returns.
This is why most traders become fed up with indicators and eventually make the smart choice to ‘cut out the middle man’ by taking steps to learn price action and develop real skills that lead to a path of true success.
Some traders may use other tools or data to help with their decisions, but price action analysis will always be boss! It is important to understand that all technical trading systems and indicators, are generated using delayed price action data and only serve you second hand and potentially misleading information.
Learning to read and understand price action directly from the charts helps you understand the logic of the market in real time, and build a true understanding of why you’re taking a trade in the first place – elevating your confidence as a trader.
Many indicators lack solid logical rationale, which is why it’s hard for traders to get behind them. They’re like the mysterious ‘black box’, you don’t truly understand what’s going on inside and just blindly follow the outputs – which is why we don’t tend to stick with them long term.

Most people will also abandon stressful ‘news trading strategies‘, because they are volatile and unpredictable; whereas price action trading is based on identifiable patterns. It encourages the mantra, “trade what you see, not what you believe.”
This is a well-received ideology, as it helps remove your personal beliefs about where price might be heading, and helps you focus on what the market is telling you instead. Price action doesn’t lie, no matter what trading strategy you use – price action is always going to be at the core, so you’re always going to better off by embracing it.
SUMMARY
In a forever changing market, a price action trading strategy will make you adapt to the many conditions the market may experience. Despite what tools, indicators or data you use to trade the market, price action will always be the real champion to follow. You will always benefit in some way by learning how interpret price action. Price action promotes a ‘trade what you see, not what you think’ mindset, which works well because at the end of the day – price has the ultimate say!
WORKING WITH DIFFERENT MARKET CONDITIONS
One of the big advantages as a price
action trader is the ability to work with most market conditions.
Granted, not all market environments can be traded safely, but at least the chart will communicate that message to you.
Markets are generally doing 1 of 3 things: Trending, ranging, or consolidating.
I am going to usher you in via the ‘keep things simple with price action’ mantra, providing an insight into how you can trade these conditions pain free, via a no-fuss plain price chart.
TRENDING MARKETS
Trending markets are considered the prime money making conditions, because they are moving markets, and price movement = potential profit.
Trends are estimated to only occur 30% of the time – so while they are in motion, you’ve got to know how to take advantage of them.
I continuously keep coming across this question: “How can I determine the trend?”
Let me clear this up for you right now. Please, remember these key points, burn them into your mind!
- A trending market is a market that is making higher highs & higher lows (bullish), or lower highs and lower lows (bearish). It’s as simple as that, that’s how you find a trend.
- Real trends are established on swing trading time frames (4 hour and above). Don’t use low time frames to go trend hunting – you may find micro intra-day trends, but they often don’t align well with the bigger picture – providing low potential for return on investment.
- Sometimes there just isn’t a trend at all.
Check out my article on trading without indicators to get more of an idea about swing points in trending markets. For now, let’s keep things simple by looking at the diagrams below. Finding trends should not be more complicated than this…
A bullish trend – higher highs and higher lows.

A bearish trend – lower highs and lower lows.

When you see the trending footprint broken – for example the market stops making higher lows, or lower highs, then the trend momentum has probably died out, and you can expect some consolidation, or ranging markets to follow.
The golden rule of trading is to buy high and sell low. However, during trending conditions, many traders do the opposite, buying high and selling low…


Remember this quote: “Buy the dips, and sell the rallies“. This is a good way to remember how to position yourself into a trend correctly, and avoid the chance of being taken out by corrections.
It’s a very common saying – meaning you look for selling opportunities when the market is rising in a bearish downtrend, or watch for buying opportunities when a market is falling in a bullish uptrend.


Sometimes, it’s important to go back to the basics and identify what a trend really is. A trend is just a stair-stepping market, not a stack of exotic indicators. Remember the core trend rules from this lesson for identifying real trends.
SUMMARY
The main issue with poor entry for traders is they can’t properly identify a trend, and if they do they trade them ‘out of position’. Keep things simple, a trend is just a succession of higher highs & higher lows, or lower highs and lower lows. Remember the golden rule for trend positioning, “buy the dips, sell the rallies” to avoid being wiped out by corrections.
RANGING MARKETS
Ranging are pretty straight forward. They are often called a ‘sideways market’ because their neutral nature makes them appear to drift to the right, horizontally.
There are two containment lines that act as the range structure. To put it simply, price bounces from range structure high to low, giving us price action traders an opportunity to make some money.

A ranging market performs a tennis match pattern, where buyers and sellers just keep knocking price back and forth between the invisible boundaries (support/resistance levels).

This will generally continue until the range structure is broken out of, and trending conditions start to organize. It’s important to remember that range boundaries are often ‘overshot’, giving the illusion a breakout is occurring. This can be very deceptive, and it does trap a lot of traders who positioned into the breakout…
You can see how these kind of fake outs can give off the wrong impression. Don’t try to trade range breakouts directly, especially if you’re new to the charts.

The best buying and selling opportunities occur at the range boundaries, in the form of reversal signals. Watch for candlestick reversal signals at these points to see if the tennis match is going to continue…


CONSOLIDATION PATTERNS
There are periods where the market doesn’t have any clear directional movement and congests to create consolidation. Some consolidation periods are just too hostile and volatile to trade and should be avoided.
Others consolidation periods do form more uniform price structures that can act like an early warning sign that a violent breakout is about to occur. These are called price squeeze patterns – sometimes referred to as wedges, or triangles.

The idea is not try trade bounces at the structure edges, but rather wait for a clear breakout outside the structure.

The important thing to know with these patterns is that you need to wait for a candle to decisively close outside the pattern before a breakout is confirmed…

Generally speaking, when you get a convincing close outside the squeeze structures, a decent move will follow. You must be very cautious about being the aggressive trade, looking to trade breakouts ‘as they happen’, because these consolidation patterns are notorious for fake outs!

As you can see above, the aggressive breakout trader can easily get trapped as the market gives off the illusion that a breakout is occurring. Getting caught in a fake out can be embarrassing. It may motivate you to negatively evaluate yourself, and kick off all kinds of self-destructive trading responses, like revenge trading.
It’s best not to trade these patterns in an aggressive manner, if you do choose to do so – just account for the extra risk of a fake out in your risk management plan.
COMMON CANDLESTICK SIGNALS
A price action trader is generally also known as a candlestick trader – because candlestick charts are the ‘chart of choice’ for many. Traders will use the candlesticks to ‘read the footsteps’ of price via the candlesticks, and use them to identify reoccurring patterns known to produce a likely outcome.
Most technical patterns are in the form of a specific candlestick anatomies. When the candlestick closes in a certain way – it can signal the price action strategist of a pending move. In the section below I am going to give a brief overview of some of the candlestick patterns we use here to forecast price movements.
REVERSAL CANDLESTICKS
THE PIN BAR
The classic pin bar was first noticed by trader Martin Pring. It’s a reversal pattern that has a characteristic shape of a ‘pin’.
It’s generally referred to as a ‘bar’ because it was discovered on a bar chart, and the name has just stuck with it over the years. Technically, it should be called a ‘pin candle’ but no one likes change…?

- Long upper or lower wick
- Small wick at opposite end
- Very narrow ranged body
- Body is located at one end of the candle range


THE REJECTION CANDLE
This is my main reversal trade signal, simply because it is the most common, and most lucrative reoccurring pattern.
The long upper or lower tail displays rejection from an area on a chart and the more aggressive bullish or bearish body shows more authority by the bears or bulls.
Rejection candles tend to have a much better response and follow-through than classic pin bars.
They work extremely well with basic technical analysis.

- Long upper or lower wick to display rejection of higher or lower prices
- Little to no wick protruding from candle close price
- A strong bearish or bullish body
- Bullish body located at the top portion of candle range, or bearish body located a bottom portion of candle range.
- Larger in range than the surrounding candles


THE OUTSIDE CANDLE
The outside candle is a self-descriptive pattern, it’s a candle that has a range that extends outside the previous candle’s range.
It does tell an interesting story! Generally how these guys form is when a breakout turns into a fake-out, followed by a massive reversal.
Firstly, the high, or low of the previous candle is broken – giving the impression a breakout is occurring.
Then the market ‘fakes out’, creating a breakout trap & reverse scenario. The market slingshots in the opposite direction and closes outside the opposite end of the previous candle’s range – creating a powerful reversal signal.

- An outside candle is a two candle setup
- Must have a higher high and lower low price than previous candle
- Close price must be outside the previous candle’s range
- Little to no wick out of the closing price end of the candle body


BREAKOUT CATALYSTS
Some candlestick patterns we use are not so many signals, but rather an ‘early bird warning’, or catalyst for an upcoming breakout.
Breakout trading can be very difficult for new traders to learn, due to the fact many breakouts turn into fakeouts, trapping newbies into bad positions.
To become good at spotting worthy breakouts – you need to be well versed in market analysis, and also know how to time your breakouts to avoid getting caught in money traps. These are topics are too lengthy to cover here, but are fully covered in the price action course if you’re interested in learning more.
In this segment, I am going to briefly introduce some of the basic catalysts we use in our breakout trading:
THE INSIDE CANDLE

THE INSIDE CANDLE

- Candle high and low price must be within the previous candle’s high and low price range
- Chained inside candles can form, they must follow the same rules. If a double inside candle forms, the last inside candle must be within the proceeding inside candles high & low price range.
- Generally, inside candles that form after an extremely large proceeding candle are discounted. Inside candles work better when they are small in range.
The inside candle is a very common pattern, in fact, it is most probably the most common candlestick pattern that occurs on the charts. This is why many traders have trouble trading them because they don’t know how to filter the good from the bad.
Inside candle breakout trading is not something I recommend for beginner traders – it’s something you should pick up as you build screen time. If you’re going to trade inside candles, stick with the ones that form on higher time frames – I am talking 12-hour charts and above.
Inside candles form due to a period of indecision when the market couldn’t build any momentum to breakout higher or lower from the previous candle’s range. Sometimes cascading inside candles can form, where you get a ‘stack’ of the inside candle within the inside candle.
Think of this as, like pressure building in a teapot, there is likely going to be an explosion. The longest chain you will probably come across is a stack of 3 inside candles in a row. Double and triple inside candle stacks are much more reliable breakout catalysts than the single inside the candle.


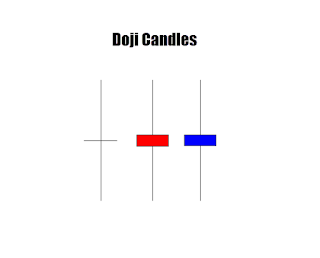
DOJI CANDLES
DOJI CANDLES

- Doji candles have a small body
- The candle body is centered within the candle range
- Wicks protruding out both ends of the body
A Doji candle can come in a variety of shapes and sizes, but ultimately is a visual representation of an indecision period in the market.
They are sometimes also called: Spinning top, dragonfly, morning star or evening star.
Doji candles are another form of breakout catalyst, but we don’t see them form as often. Generally, the same principles apply to the Doji as they do to the inside candle, big ones are discounted.
Trading dojis takes a bit of screen time to develop confidence. Generally, the best dojis form around major levels in the market, where they can double as a reversal signal.


DIFFERENT MEDIUMS OF PRICE ACTION
Price action is not just exclusive to the classic candlestick charts, though that is what most people are familiar with. There are other mediums of price action that traders can use to get different perspectives on the market. These other mediums may allow you to see opportunities that have eluded you with your normal candlestick chart.
This is an area I am researching heavily at the moment, but the preliminary findings look promising. So, lets looks at the classic candlestick charts and some other price action mediums available to you…
CANDLESTICK CHARTS
Most traders believe New York close charts are the only charts you should be looking at. But the reality is, New York close charts only provide a reference point to base your analysis on.
I am not saying New York close charts are bad, they are excellent and I use them every day. But, have you considered using the London open time as a reference point for your cross analysis?
Let’s compare a New York close chart and a London Open chart…

With the London open charts, we are able to see a strong sell signal that was otherwise not as obvious on the New York Close chart.

font-family: inherit; font-size: inherit; font-stretch: inherit; font-style: inherit; font-variant: inherit; font-weight: inherit; line-height: inherit; margin-bottom: 20px; padding: 0px; vertical-align: baseline;">
But this is no reason to discount NYC charts either, as we can see a nice big sell signal there which was not as obvious on the London Open chart.
Here is a New York Open chart thrown in for good measure…

There isn’t anything obvious screaming out here, but this is just to show now with this one pair, we can have 3 different time perspectives which dramatically changes the price action.
This is like a panning for gold approach where you look through different time slots and see if anything jumps out at you.
You could really shift the charts 23 different ways, as you could generate a chart with every single GMT hour, but I think it’s important to keep things simple and stick to the ‘main event’ times like New York close, London open and the New York open if you really wanted to
The Complete Guide To Price Action Trading(all you need to know about price action trading 2019 in nigeria)
 Reviewed by zeal
on
9:36:00 AM
Rating:
Reviewed by zeal
on
9:36:00 AM
Rating:
Reviewed by zeal
on
9:36:00 AM
Rating: